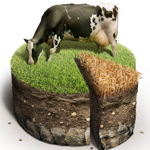
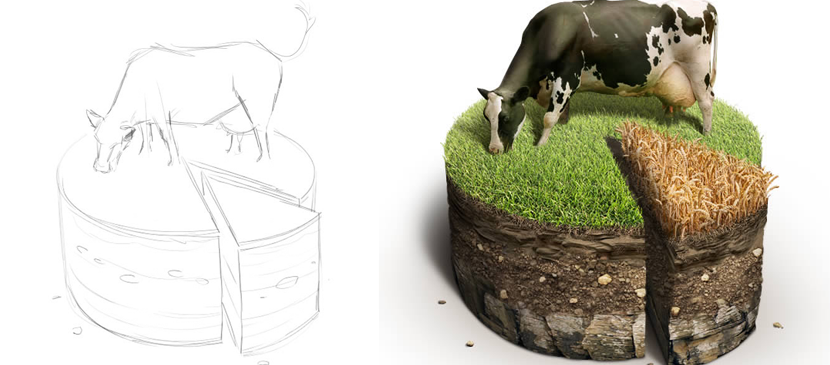
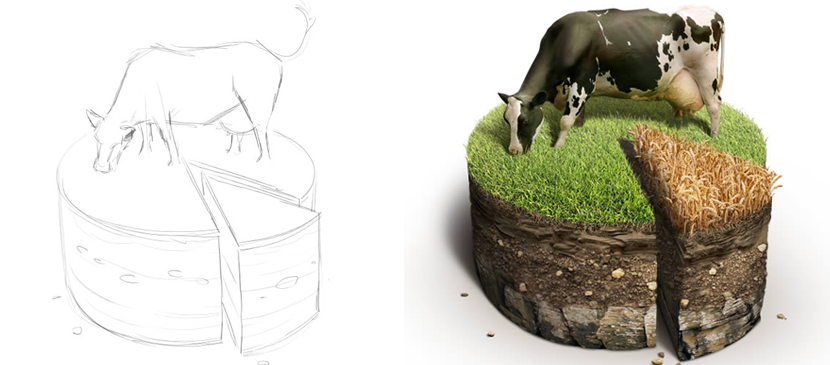
Infographics are an efficient and fun way to present data. You may notice, however, that infographics are often flat vector illustrations. In this tutorial, we will show you how to create a soil cake using photographic elements for use in pie charts. Let’s get started!
日本語: まだ 日本語 版の翻訳はありません。英語で見る — showing the original English article below.
Making a Special Pie Chart in Farming Style
日本語
Photoshop Lady のおすすめ
専門家のガイド、レビュー、ヒントを受信箱にお届けします。スパムなし、いつでも解除可能。