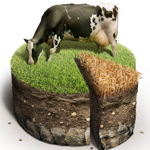
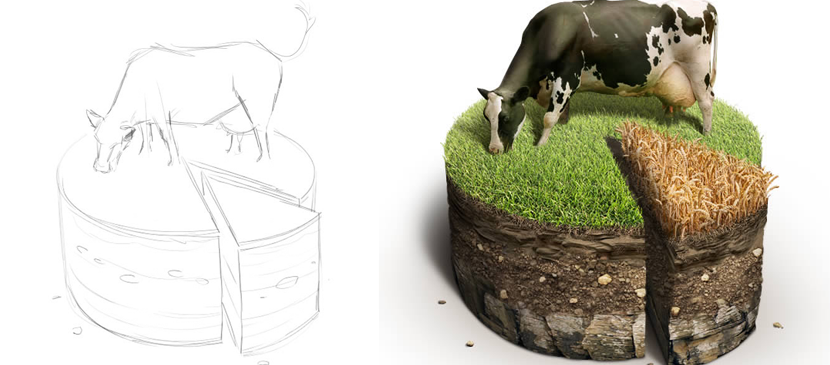
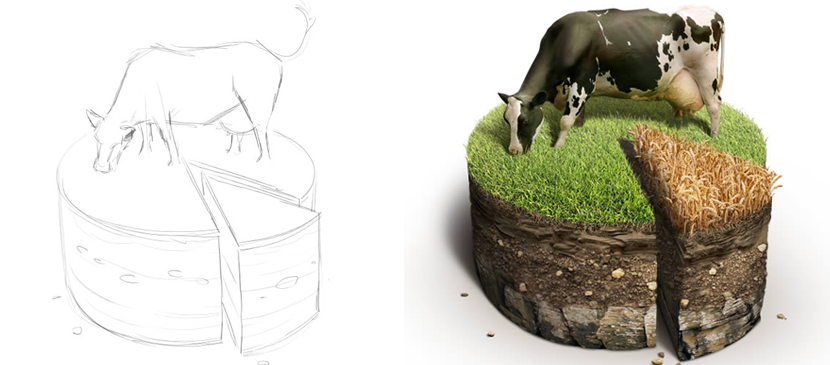
Infographics are an efficient and fun way to present data. You may notice, however, that infographics are often flat vector illustrations. In this tutorial, we will show you how to create a soil cake using photographic elements for use in pie charts. Let’s get started!
العربية: لا توجد ترجمات متاحة بعد بـالعربية.عرض بالإنجليزية — showing the original English article below.
Making a Special Pie Chart in Farming Style
العربية
أفضل ما في Photoshop Lady
أدلة ومراجعات ونصائح متخصصة مباشرة إلى بريدك الإلكتروني. بدون رسائل مزعجة، يمكنك إلغاء الاشتراك في أي وقت.